


The U.S. Dollar Index (Ticker: DXY) is the creation of the New York Board of Trade (NYBOT). It was established in 1973 for tracking the value of the USD against a basket of currencies, which, at that time, represented the largest trading partners of the United States. It began with 17 currencies from 17 nations, but the launch of the euro subsumed 12 of these into one, so the USDX tracks only six currencies today.
| Euro | 57.6% |
| Japanese yen | 13.6% |
| Pound sterling | 11.9% |
| Canadian dollar | 9.1% |
| Swedish krona | 4.2% |
| Swiss franc | 3.6% |
| Source: NYBOT, " US Dollar Index", pg.3 (PDF) | |
The Index is described by the NYBOT as "a trade weighted geometric average".[59] The baseline of 100.00 on the USDX was set at its launch in March 1973. This event marks the watershed between the wider margins arrangement of the Smithsonian regime and the period of generalized floating that led up to the Second Amendment of the Articles of Agreement of the IMF. Since 1973, the USDX has climbed as high as the 160s and drifted as low as the 70s.
The USDX has not been updated to reflect new trading realities in the global economy, where the bulk of trade has shifted strongly towards new partners like China and Mexico and oil-exporting countries while the United States has de-industrialized.
Dollarization and fixed exchange rates
Other nations besides the United States use the U.S. dollar as their official currency, a process known as official dollarization. For instance, Panama has been using the dollar alongside the Panamanian balboa as the legal tender since 1904 at a conversion rate of 1:1. Ecuador (2000), El Salvador (2001), and East Timor (2000) all adopted the currency independently. The former members of the U.S.-administered Trust Territory of the Pacific Islands, which included Palau, the Federated States of Micronesia, and the Marshall Islands, chose not to issue their own currency after becoming independent, having all used the U.S. dollar since 1944. Two British dependencies also use the U.S. dollar: the British Virgin Islands (1959) and Turks and Caicos Islands (1973). The islands Bonaire, Sint Eustatius and Saba have adopted the dollar on January 1, 2011 as a result of the dissolution of the Netherlands Antilles.[60][61]
Some countries that have adopted the U.S. dollar issue their own coins: See Ecuadorian centavo coins, Panamanian Balboa and East Timor centavo coins.
Some other countries link their currency to U.S. dollar at a fixed exchange rate. The local currencies of Bermuda and the Bahamas can be freely exchanged at a 1:1 ratio for USD. Argentina used a fixed 1:1 exchange rate between the Argentine peso and the U.S. dollar from 1991 until 2002. The currencies of Barbados and Belize are similarly convertible at an approximate 2:1 ratio. The Netherlands Antillean guilder (and its successor the Caribbean guilder) as well as the Aruban florin are pegged to the Dollar at a fixed rate of 1:1.79. In Lebanon, one dollar is equal to 1500 Lebanese pound, and is used interchangeably with local currency as de facto legal tender. The exchange rate between the Hong Kong dollar and the United States dollar has also been linked since 1983 at HK$7.8/USD, and pataca of Macau, pegged to Hong Kong dollar at MOP1.03/HKD, indirectly linked to the U.S. dollar at roughly MOP8/USD. Several oil-producing Arab countries on the Persian Gulf, including Saudi Arabia, peg their currencies to the dollar, since the dollar is the currency used in the international oil trade.
The People's Republic of China's renminbi was informally and controversially pegged to the dollar in the mid-1990s at ¥ 8.28/USD. Likewise, Malaysia pegged its ringgit at RM3.8/USD in 1997. On July 21, 2005 both countries removed their pegs and adopted managed floats against a basket of currencies. Kuwait did likewise on May 20, 2007,[62] and Syria did likewise in July 2007.[63] However, after three years of slow appreciation, the Chinese yuan has been de facto re-pegged to the dollar since July 2008 at a value of ¥6.83/USD; although no official announcement had been made, the yuan has remained around that value within a narrow band since then, similar to the Hong Kong dollar.
Belarus, on the other hand, pegged its currency, the Belarusian ruble, to a basket of foreign currencies (U.S. dollar, euro and Russian ruble) in 2009.[64]
In some countries such as Peru and Uruguay, the USD is commonly accepted although not officially regarded as a legal tender. In Mexico's border area and major tourist zones, it is accepted as if it were a second legal currency. Many Canadian merchants close to the border also accept U.S. dollars, though at a value that usually favours the merchant. In Cambodia, U.S. notes circulate freely and are preferred over the Cambodian riel for large purchases,[65][66] with the riel used for change to break 1 USD. After the U.S. invasion of Afghanistan, U.S. dollars are accepted as if it were legal tender. Prices of most big ticket items such as houses and cars are set in U.S. dollars[citation needed].
[edit] Decline of U.S. Dollars
In the 2000s the U.S. currency into high stage of decay, with the worsening housing crisis. The euro also contributed in a fundamental way for this decline, it became much easier to carry a 500 Euro note that a handful of U.S. dollar notes, as well as the growth of economies that are part of the BRICS (Brazil, Russia, India, China and South Africa)
[edit] Dollar versus Euro
| Year | Highest ↑ | Lowest ↓ | ||||
|---|---|---|---|---|---|---|
| Date | Rate | Date | Rate | |||
| 1999 | 03 Dec | €0.9985 | 05 Jan | €0.8482 | ||
| 2000 | 26 Oct | €1.2118 | 06 Jan | €0.9626 | ||
| 2001 | 06 Jul | €1.1927 | 05 Jan | €1.0477 | ||
| 2002 | 28 Jan | €1.1658 | 31 Dec | €0.9536 | ||
| 2003 | 08 Jan | €0.9637 | 31 Dec | €0.7918 | ||
| 2004 | 14 May | €0.8473 | 28 Dec | €0.7335 | ||
| 2005 | 15 Nov | €0.8571 | 03 Jan | €0.7404 | ||
| 2006 | 02 Jan | €0.8456 | 05 Dec | €0.7501 | ||
| 2007 | 12 Jan | €0.7756 | 27 Nov | €0.6723 | ||
| 2008 | 27 Oct | €0.8026 | 15 Jul | €0.6254 | ||
| 2009 | 04 Mar | €0.7965 | 03 Dec | €0.6614 | ||
| 2010 | 08 Jun | €0.8374 | 13 Jan | €0.6867 | ||
| Source: Euro exchange rates in USD, ECB | ||||||
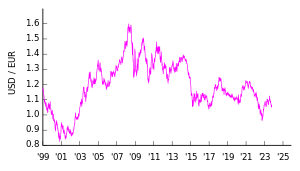
Not long after the introduction of the euro (€ ; ISO 4217 code EUR) as a cash currency in 2002, the dollar began to depreciate steadily in value, as it did against other major currencies.[67] From 2003 to 2005, this depreciation continued, reflecting a widening current account deficit. Although the current account deficit began to stabilize in 2006 and 2007, depreciation persisted.[67] The fallout from the subprime mortgage crisis in 2008 prompted the Federal Reserve to lower interest rates in September 2007,[68] and again in March 2008,[69] sending the euro to a record high of $1.6038, reached in July 2008.[70]
In addition to the trade deficit, the U.S. dollar's decline was linked to a variety of other factors, including a major spike in oil prices.[71] Economists such as Alan Greenspan suggested that another reason for the decline of the dollar was its decreasing role as a major reserve currency. Chinese officials signaled plans to diversify the nation's $1.9 trillion reserve in response to a falling U.S. currency which also set the dollar under pressure.[72][73]
However, a sharp turnaround began in late 2008 with the onset of the global financial crisis. As investors sought out safe-haven investments in U.S. treasuries and Japanese government bonds from the financial turmoil, the Japanese yen and United States dollar sharply rose against other currencies, including the euro.[74] At the same time, however, many countries such as China,[75] India and Russia announced their intentions to diversify their foreign reserve portfolios away from the U.S. dollar.[76]
The European sovereign debt crisis that unfolded in 2010 sent the euro falling to a four-year low of $1.1877 on June 7, as investors considered the risk that certain Eurozone members may default on their government debt.[77] The euro's decline in 2008-2010 had erased half of its 2000-2008 rally.[70]
[edit] Exchange rates
[edit] Historical exchange rates
| 1970* | 1980* | 1985* | 1990* | 1993 | 1999 | 2000 | 2001 | 2002 | 2003 | 2004 | 2005 | 2006 | 2007 | 2008 | 2009 | 2010 | |
|---|---|---|---|---|---|---|---|---|---|---|---|---|---|---|---|---|---|
| Euro | - | - | - | 0.8343 | 0.8551 | 0.9387 | 1.0832 | 1.1171 | 1.0578 | 0.8833 | 0.8040 | 0.8033 | 0.7960 | 0.7293 | 0.6791 | 0.7176 | 0.6739 |
| Japanese yen | 357.6 | 240.45 | 250.35 | 146.25 | 111.08 | 113.73 | 107.80 | 121.57 | 125.22 | 115.94 | 108.15 | 110.11 | 116.31 | 117.76 | 103.39 | 93.68 | 87.78 |
| Pound sterling | 0.4164 | 0.4484[79] | 0.8613[79] | 0.6207 | 0.6660 | 0.6184 | 0.6598 | 0.6946 | 0.6656 | 0.6117 | 0.5456 | 0.5493 | 0.5425 | 0.4995 | 0.5392 | 0.6385 | 0.4548 |
| Canadian dollar | 1.081 | 1.168 | 1.321 | 1.1605 | 1.2902 | 1.4858 | 1.4855 | 1.5487 | 1.5704 | 1.4008 | 1.3017 | 1.2115 | 1.1340 | 1.0734 | 1.0660 | 1.1412 | 1.0298 |
| Mexican peso | - | 2.801 | 2.671 | 2.501 | 3.1237 | 9.553 | 9.459 | 9.337 | 9.663 | 10.793 | 11.290 | 10.894 | 10.906 | 10.928 | 11.143 | 13.498 | 12.623 |
| Renminbi yuan | - | 1.7050 | 2.9366 | 4.7832 | 5.7620 | 8.2783 | 8.2784 | 8.2770 | 8.2771 | 8.2772 | 8.2768 | 8.1936 | 7.9723 | 7.6058 | 6.9477 | 6.8307 | 6.7696 |
| Singapore dollar | - | - | 2.179 | 1.903 | 1.6158 | 1.6951 | 1.7361 | 1.7930 | 1.7908 | 1.7429 | 1.6902 | 1.6639 | 1.5882 | 1.5065 | 1.4140 | 1.4543 | 1.3629 |
| Source: Last 4 years 2005-2002 2003-2000 1996-1999 1993-1996 1990 1970-1992 1970-1985 Canada, China, Mexico 1. Mexican peso values prior to 1993 revaluation. | |||||||||||||||||
No comments:
Post a Comment